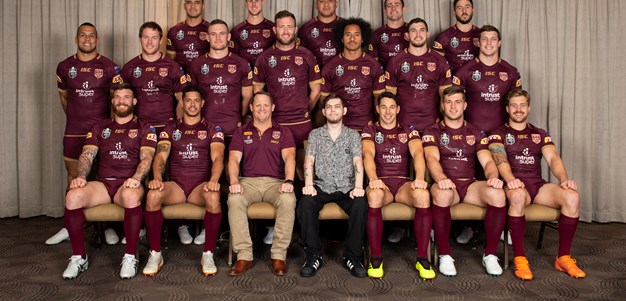
The fantastic representative round provided a spotlight on rugby league's popularity at both an interstate and international level.
While State of Origin Game II was played before a packed ANZ Stadium crowd in excess of 82,000 spectators, there were strong and buoyant crowds elsewhere for the Pacific Test events and the ground-breaking England v New Zealand match in Denver.
The awe-inspiring speed and skill on display in Origin II was remarked upon by numerous players and officials.
A comparison of key game statistics from the weekend shows how that impression can be reinforced by statistics.
Despite the other matches all being entertaining in their own right, State of Origin was on another level when it came to packing in non-stop action and executing at maximum efficiency.
PASSES IN MATCH
State of Origin - 486
PNG v Fiji – 407
England v NZ - 404
Tonga v Samoa – 353
RUNS IN MATCH
State of Origin - 348
England v NZ - 347
PNG v Fiji – 319
Tonga v Samoa – 316
COMPLETIONS
State of Origin - 86%
Tonga v Samoa - 77%
PNG v Fiji – 76%
England v NZ - 74%
COMPLETED TACKLES
State of Origin – 708
PNG v Fiji - 685
England v NZ - 634
Tonga v Samoa – 590
EFFECTIVE TACKLES
Fiji – 94%
Queensland - 90%
New South Wales - 89%
PNG – 86%
New Zealand - 83%
Tonga - 82%
Samoa - 79%
England - 77%
ERRORS
State of Origin - 16
England v NZ - 18
Tonga v Samoa – 20
PNG v Fiji - 20


