It's no secret 2019 was a huge disappointment for Titans fans and there are plenty of statistical areas where the Gold Coast club lagged the field – but can they fix those areas in time to be competitive in 2020?
The season started on the worst possible note with inspirational skipper Ryan James sidelined with an ACL injury back in round six right as the team started to find some form with consecutive wins and they never really recovered from there.
Injuries were unfortunately a theme right across the squad with plenty of key players missing significant time but there were also some bright spots with some youngsters emerging as possible stars of the future.
Home & Away record
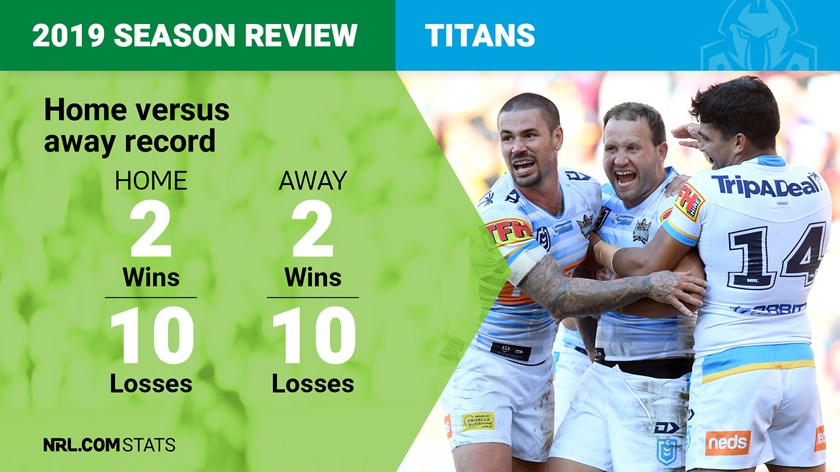
Home: 2-10. Away: 2-10.
Those two home wins came back-to-back – the above-mentioned pair of wins were the final two games of James' season in rounds five and six. Narrow losses followed to the Bulldogs, Cowboys and Warriors before much heavier ones to several finals teams as the club sadly failed to win at home past April.
The away wins were also consecutive, in rounds 11 and 13 either side of a loss at home, and were arguably the high points of the season coming against top eight sides Manly and Brisbane. Both were fairly convincing and a win over Brisbane is always particularly sweet. If anything those two performances proved the club probably should have won a few more games in 2019.
Four overall wins represented the club's worst return in its 13 seasons.
Post-contact metres
Overall, metres gained – and by extension post-contact metres – weren't the Titans' biggest worry in 2019. It was conceding them that was the issue.
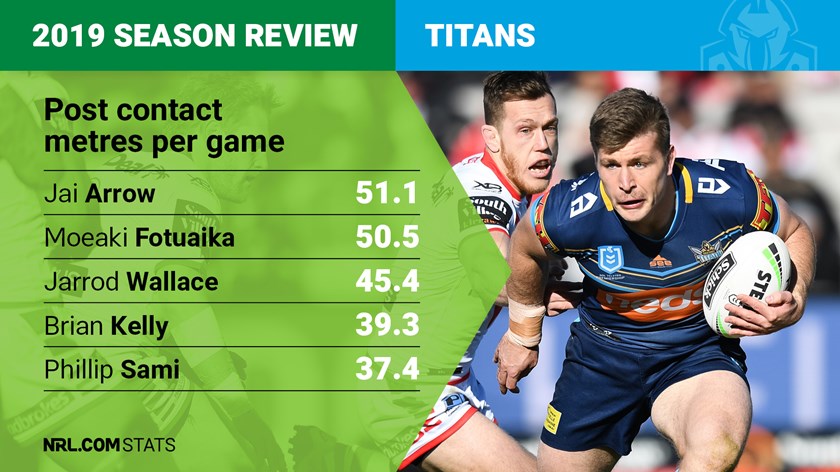
The Titans finished 13th for PCM per game at 451 per match; Jai Arrow was the club's best with 51.1 per game putting him just outside an NRL-wide top 10. They were 10th best on a per-carry basis at 2.57 metres per run with breakout young prop Moeaki Fotuaika's 3.79 per run good enough for sixth best among all players in the competition.
However the club conceded the second-most PCM per game with 502, just behind the Bulldogs (512) and the most per run with 2.74, showing first contact in defence and numbers in the tackle were severely lacking.
Tries scored by channel
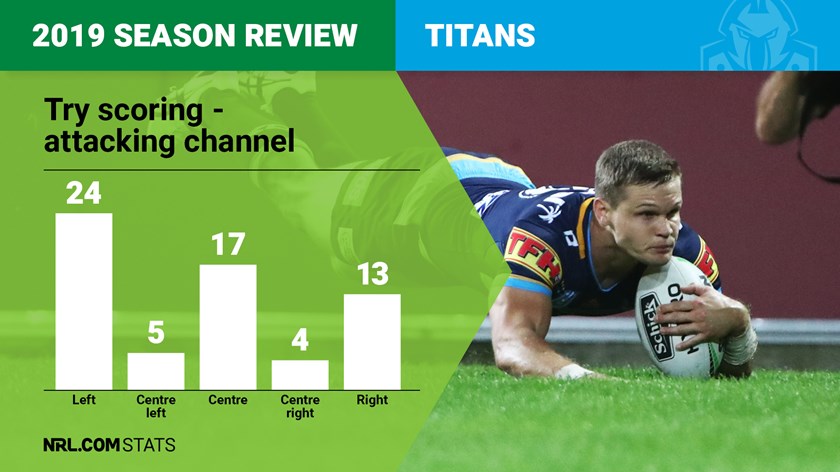
Only the Bulldogs scored fewer tries than the Titans in 2019 so scoring points overall was an issue but of their 63 four-pointers, 24 came on the left sideline as Phillip Sami and Dale Copley in particular got across the stripe semi-regularly.
There were 17 more in the middle channel that were spread around, though the likes of Tyrone Roberts and Ryley Jacks scheming around the ruck helped them to a few through the middle third. Anthony Don was the main contributor to the 13 tries that came on the right flank.
Tries conceded by channel
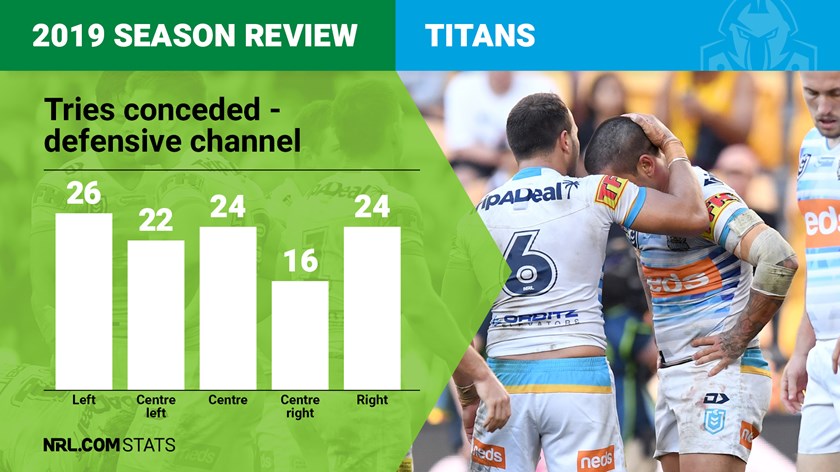
The Titans' 112 tries conceded was an NRL high with the Dragons (101) the only other club to concede triple digits through 2019. Worryingly they came right across the board so there's no one specific area that can be tidied up. The left (26), centre-left (22), centre (24) and far right (24) channels all conceded over 20 tries with only the centre-right channel (16) keeping things relatively quiet.
Tries conceded from penalties
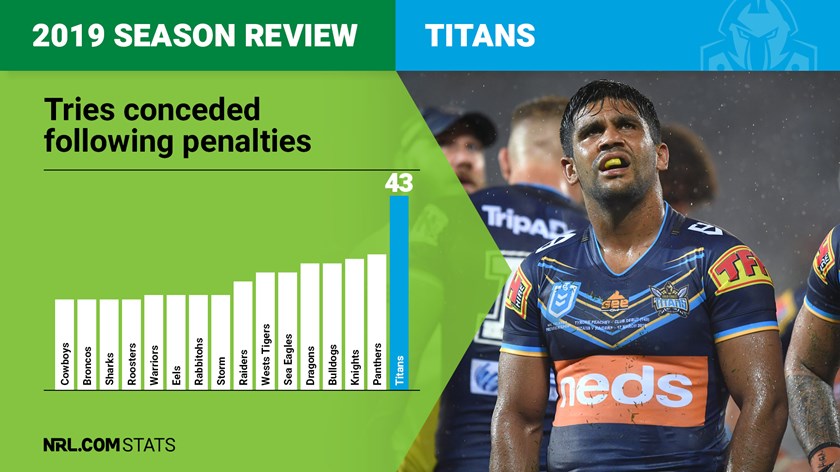
Responding to in-game adversity was another area of glaring weakness for the Gold Coast in 2019, with 43 tries conceded in the set following a penalty conceded. That is easily the most in the NRL, with Penrith (30) next worst.
Penrith were the most-penalised team in the comp with 189 infringements while the Titans were mid-table at 161 penalties, meaning their strike rate of defending penalties was significantly worse than any other team.
All up they conceded in the set after a penalty more than once for every four penalties conceded.
Metres gained from offloads
There's no doubt offloads can be a double-edged sword; on one hand they can help break down the competition's tightest defences while on the other contribute to a lower completion rate that puts your team under unnecessary pressure.
The Titans were mid-table for total offloads with 225 (10th most) but were less effective than other teams at using them with the Roosters, Rabbitohs and Raiders all throwing fewer offloads but making more ground from offloads.
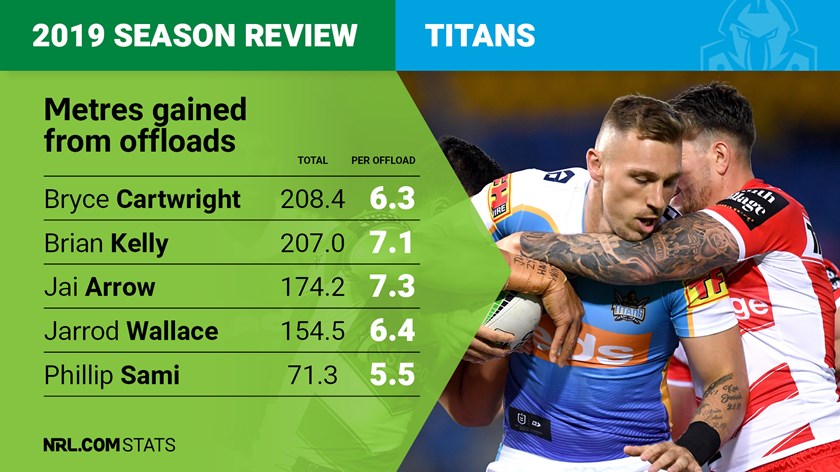
The Titans made the 13th most metres from offloading but were worst in the NRL on a per offload basis, gaining an average of just 5.9 metres per offload thrown. Bryce Cartwright and Brian Kelly led the way, each contributing just over 200 metres for the season of ground gained at 6.3 and 7.1 metres per offload respectively.
Goal-kicking accuracy
Goal kicking was mostly pretty reliable for the Titans in 2019, and although one narrow loss could have been turned into their fifth win if not for two missed kicks, the good news is that it didn't affect their ladder position.
The 6-4 round 12 loss to North Queensland would have been reversed had a miss each from Ash Taylor and Tyrone Roberts been successful.
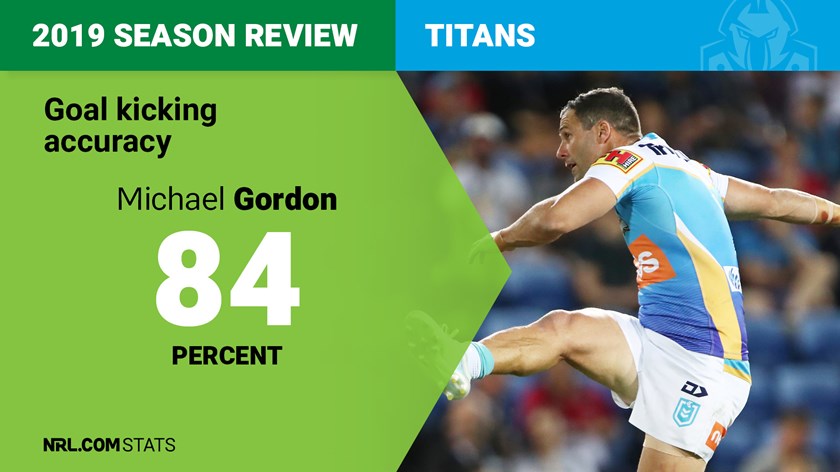
Taylor had some struggles off the tee, finishing with 11 goals from 19 attempts at 58% successful but the other three kickers used – Roberts (15 from 18 at 83%), Michael Gordon (27 from 32 at 84%) and Tyrone Peachey (six from seven at 86%) all kicked over 80%.
All up the Titans were ninth best in the NRL for goal-kicking accuracy.
Run metre differential
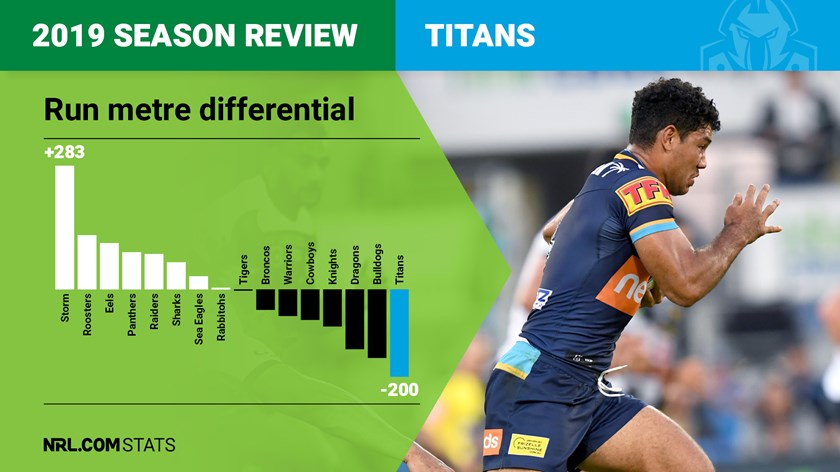
The bread and butter of any rugby league game is getting yourself upfield better than your opponents by running hard with the ball and tackling hard without it, and this was the Titans' biggest shortcoming in 2019.
They gained the fewest metres per game (equal with Newcastle) at 1505 per week while conceding the second most at 1705 (only Canterbury at 1734 conceded more).
Their net metres differential per game of -200 was far worse than either of those sides or any other team, with Canterbury next worst at -152 and the Dragons third worst at -137, with no other club doing worse than -100.
Drop-out ratio
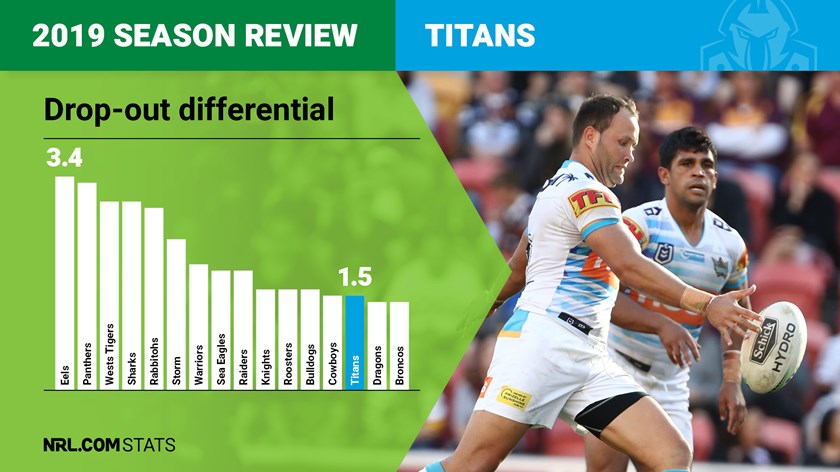
The Titans forced just 32 goal-line drop-outs in 2019, fewer than any club other than the Roosters (who were too busy scoring tries to worry about drop-outs).
And it's not like they were down the bottom simply because they weren't in range often enough to try, because they still managed to give away 22 seven-tackle restarts – more than any club apart from the Storm (24), Broncos and Dragons (both 25).
The Broncos and Dragons were similarly poor at gaining repeat sets and are the only two clubs to perform fractionally worse than the Titans in a ratio of drop-outs forced to 20-metre restarts given away.
While the competition's best, like the Eels and the Panthers, forced more than three drop-outs per seven tackle set conceded, the Titans managed just 1.5.
Missed tackle to try ratio
As mentioned, the Titans conceded the most tries in 2019 but it wasn't through missing far more tackles than other clubs.
All up they missed exactly 800 tackles through the regular season, far fewer than the likes of Penrith (939) and Canterbury (865), putting them at fifth-worst.
With 112 tries conceded that gives them a missed tackle to try ratio of 7.1, with the Dragons (7.2) and Tigers the only other clubs under 8.
This stat is well-correlated to ladder success, with the only real outliers being Penrith at the upper end – through sheer weight of how many times first contact was broken without leading to a line break – and Manly, who missed so few tackles the ratio came down despite their consistent on-field form.


